CLICK HERE TO VIEW A DOWNLOADABLE PDF
TEACHER AND STUDENT DATA
Excerpts from the MEC MSP Evaluator’s Report January 2016, with notes from MEC:
TEACHER DATA
Note from MEC: The Reformed Teacher Observation Protocol (RTOP), a standardized means for assessing lesson design, content and classroom culture was used to measure changes in classroom practice. The RTOP was administered in spring of Year 1 prior to the start-up of the MEC MSP work. It was administered again in spring of Year 2 and in spring of Year 3. These new teacher leaders, Regional Math Support Team teachers (RMSTs) have expressed a desire to have the RTOP administered over the next few years as they now have a clear vision of what they’re working toward in their classrooms, and are convinced their practice is only going to get better. Whether or not the changes in classroom practice are lasting is an important question, and following up in this way would be an optimal next step. For information about the professional development program these teachers participated in, CLICK HERE.
RTOP means showed impressive annual gains over baseline each year. In fact, the mean RTOP score among 3-year RMSTs nearly doubled from Y1 to Y3 (46.18 vs. 86.82)… The Y3 mean score for RMSTs increased by nearly 41 points as compared with Y1 (86.82 vs. 46.18). One-way repeated measures of analysis of variance revealed this difference to be significant at p < .001
Chart 2
RTOP 3 year means for all participants

Note from MEC: The RTOP contains 25 items, each on a scale of 0 to 4.
Chart 3
RTOP item mean scores by year for all participants
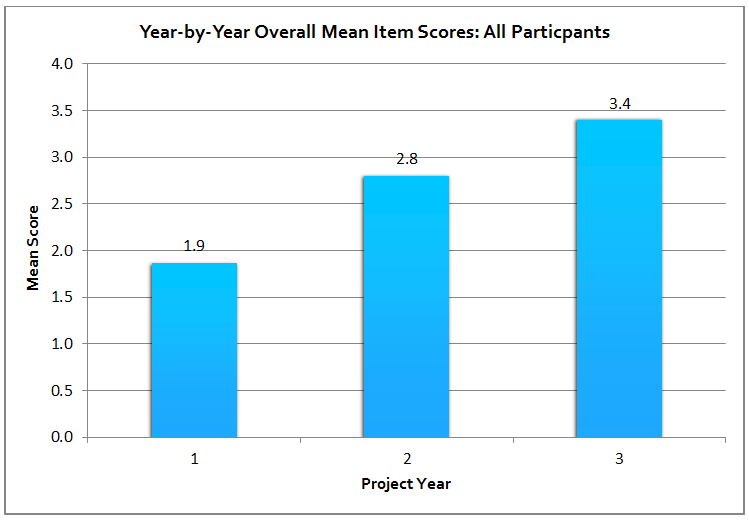
Chart 4
RTOP item means by year for all participants

STUDENT DATA
NOTE FROM MEC: This Smarter Balanced Assessment student data is from spring of 2015, just two years into the intervention. The participant group consists of students of MEC MSP teacher participants, now new teacher leaders. The data are from students of the 30 teacher participants who teach in 29 different school districts throughout the State.
The findings revealed strong SBA performance by students in participating classrooms and offered a robust conclusion to the project. Meaningful to administrators and others is the percent of students who met the standard. Differences were impressive: overall, 60% of participant students met state standards compared with 38% of their comparison counterparts.
Chart 9
SBA percent students meeting standard, all grades combined
- Participant n=1,253
- Comparison n=7,053
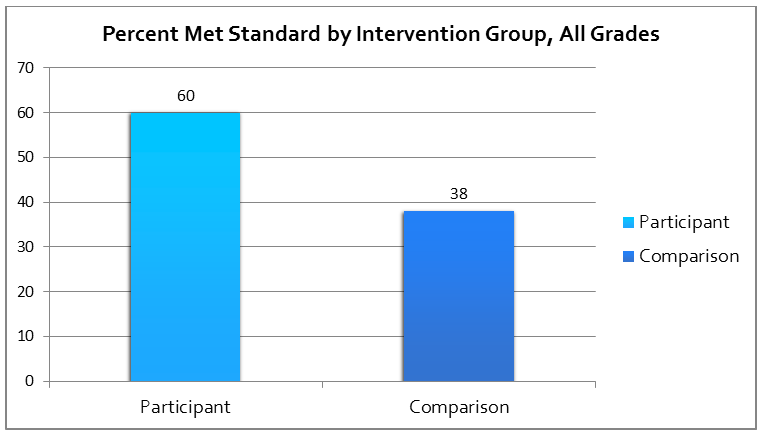
Chart 7
Mean SBA scale scores by grade/ column chart
- Participant n=1,253
- Comparison n=7,053

Chart 8
Mean SBA scale scores by grade/ line chart
- Participant n=1,253
- Comparison n=7,053

Note from MEC: In the disaggregated data that follows we see both success and sites for further growth and study. Remembering that this data represents students who had only one or two years at most in transformed classrooms, we are left wondering what is possible were students to have multiple years in such classrooms. Clearly an income achievement gap still exists, as well as gaps between different ethnic groups. There is much work left to be done on those fronts. Yet we are encouraged by the significant progress demonstrated across nearly all demographic groups.

Chart 10
SBA percent students met standard by income and intervention, all grades
- Participant low income n=507
- Comparison low income n=4,366

Mean SBA scale score by income within group
- Comparison low income met n= 1156
- Comparison low income not met n=3216
- Comparison standard income met n=1545
- Comparison standard income not met n=1130
- Participant low income met n=205
- Participant low income not met n=302
- Participant standard income met n=540
- Participant standard income not met n=204

Chart 11
SBA percent students meeting standard by intervention and gender, all grades combined
- Male Participant n=640
- Female Participant n=613
- Male Comparison n=3,507
- Female Comparison n=3,546

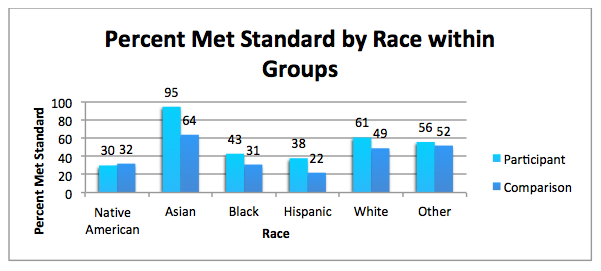
Chart 12
SBA percent students meeting standard by race and group, all grades combined
PARTICIPANT / COMPARISON
- Native American n=21 / n=148
- Asian n=92 / n= 146
- Black n=21 / n= 107
- Hispanic n=184 / n= 3247
- White n=850 / n=3241
- Other n=86 / n= 400